

What is watched
Monitoring and BI, separately
Servers and queues in one tool, last night's numbers in another.
With MetricMonitor
The flow and the business figure it produces, on the same screen.

Loading
MetricMonitor puts business KPIs and the systems that produce them on one screen. When fill rate drops or claims slow down, the feed that stalled is on the same dashboard, not in a different tool owned by a different team.
What is in the box
What it does
The gap is between them. Infrastructure tools watch systems and know nothing about the business number; reporting tools watch the number and know nothing about the system. The two-day gap between a KPI moving and someone finding the cause lives in that space.
| The question | Monitoring and BI, separately | With MetricMonitor |
|---|---|---|
| What is watched | Servers and queues in one tool, last night's numbers in another. | The flow and the business figure it produces, on the same screen. |
| When you find out | At the morning report, or when a customer calls to tell you. | When the threshold breaks, with what changed and when. |
| Finding the cause | Two tools, two timelines, and a meeting to line them up. | One timeline, so the stalled feed sits next to the dip it caused. |
| Who can read it | A dashboard per team, each in a tool that team owns. | Role-based views built from one set of metric definitions. |
| Proving the SLA | Assembled from exports when somebody asks for it. | Tracked continuously, with the history already there. |
Monitoring and BI, separately
Servers and queues in one tool, last night's numbers in another.
With MetricMonitor
The flow and the business figure it produces, on the same screen.
Monitoring and BI, separately
At the morning report, or when a customer calls to tell you.
With MetricMonitor
When the threshold breaks, with what changed and when.
Monitoring and BI, separately
Two tools, two timelines, and a meeting to line them up.
With MetricMonitor
One timeline, so the stalled feed sits next to the dip it caused.
Monitoring and BI, separately
A dashboard per team, each in a tool that team owns.
With MetricMonitor
Role-based views built from one set of metric definitions.
Monitoring and BI, separately
Assembled from exports when somebody asks for it.
With MetricMonitor
Tracked continuously, with the history already there.
How it fits together
We ingest and normalise the metrics, evaluate them against the thresholds you define, and deliver them to whoever needs them, in the tool they already use.
Scroll the diagram sideways →
Capabilities
A dashboard nobody trusts, an alert nobody acts on, and a connector that needs a project each time are the three ways this kind of tool fails.
Dashboards
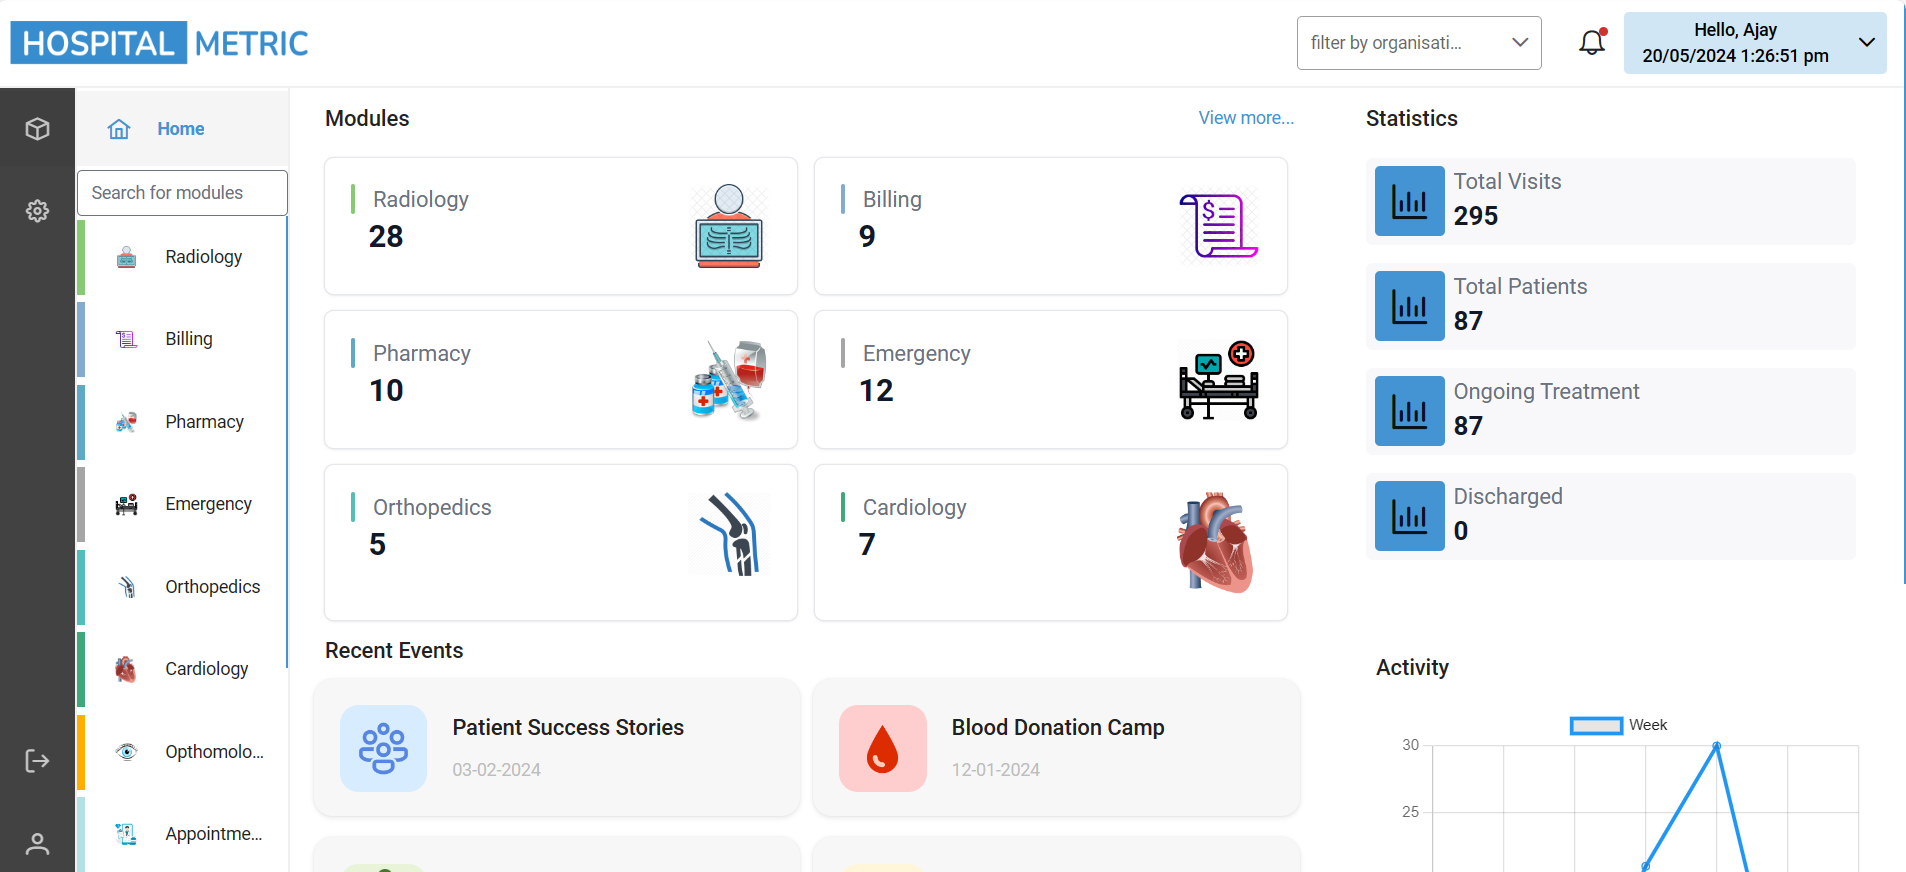
Operations, quality and leadership each get a layout built for them, drawing on the same metric definitions, so nobody is arguing about whose figure is right.
Alerts
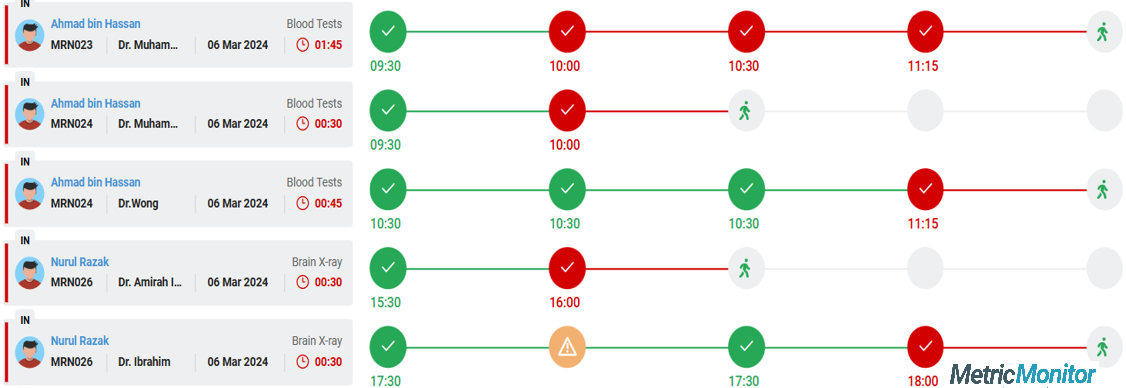
Thresholds and composite conditions, routed to email, chat or your incident tool, carrying what changed and when rather than only that something did.
Ingestion
Metrics arrive from ERP, CRM, EHR and line-of-business systems as well as cloud services, and we normalise them so signals from different places can be compared on the same axis.

Under the hood
Standard interfaces on the way in and the tools your teams already use on the way out.
How metrics arrive, without a custom pipeline for each source.
The systems your teams already run, read rather than replaced.
The tools operations already watch, so an alert lands where work happens.
Who uses it
It is deployed in healthcare, retail, manufacturing and logistics, where an operational problem becomes a commercial one within hours.
The live view, and an alert that arrives before the phone call does.
Live dashboardsOutcome measures tracked continuously rather than assembled for a review.
SLO trackingOne definition per metric, so the same question does not get three answers.
Metric definitionsThe same figures the operating teams are looking at, not a version re-cut monthly.
ReportingQuestions
Infrastructure monitoring tells you a service is healthy. It cannot tell you that fill rate has dropped, because it does not know what fill rate is. MetricMonitor holds both, so the stalled feed and the business number it feeds sit on one timeline. If your existing tooling already does that, you may not need this.
Get started
Tell us which number you are trying to watch and we will schedule a short walkthrough of MetricMonitor.